

Improve the impact of ad extensions in ad rank by breaking up the difficult-to-analyze aggregate sitelink performance data to the campaign level using pivot tables.
Do you have similar sitelinks across multiple campaigns and want to see how it stacks up? Google’s data is ok, but it’s tough to find actionable insight, especially in accounts where the performance data may differ across campaigns.
The impact of sitelinks matter in your ad rank.
In addition to the SERP changes to remove sidebar ads, Google also changed how they calculate ad rank. According to Google’s definition of Ad Rank, “We also incorporate the expected impact from your extensions and other ad formats when computing your Ad Rank. When estimating the expected impact of extensions and ad formats, we consider such factors as the relevance, clickthrough rates, and the prominence of the extensions or formats on the search results page.”
Just having ad extension in your account can help, however the real goal to continue to optimize and IMPROVE your expected ad extension impact. If you optimize sitelinks by campaign you allow yourself the opportunity to continue to move the ad rank needle.
Sitelinks are not set it and forget it Adwords feature.
As an advertiser, you should be reviewing your sitelinks on a regular basis to find ways to make your sitelinks more relevant to the keyword/ad they are servicing.
I challenge all of you to, at the very least, go into your account and see the sitelinks performance on your highest-traffic campaigns. Are there sitelinks that stick out as high or low performers? They can give you a great starting point to stop showing the low performers and start testing new contenders.
Sitelink Analysis Using Pivot Tables
There is also a way to do this in Excel so you can see all of the CTRs of your sitelinks lined up across all campaigns using a tricky to set up, but easy to analyze format. Download this workbook to following along.
As an example, we ran an analysis for a client of ours who is a neurologist. We saw that branded search terms really responded well to “About Us” and “Testimonial” enhanced sitelinks, but the general search terms responded stronger to the “Conditions Treated” and “Procedures Performed” sitelinks.
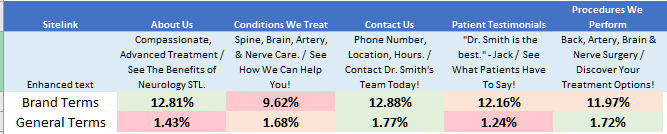
This gave us great next steps to better optimize our sitelinks down to the campaign level, improve the user’s experience with our ad (AKA better CTR), and overall quality score.
Disclaimer: I’ve provided several screenshots for a step by step walkthrough, but a working knowledge of Excel and pivot tables may be necessary.
1) Run a Sitelink Performance Report in Google AdWords Dimensions Tab.
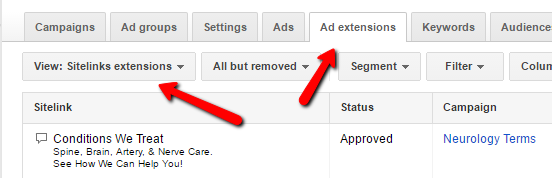
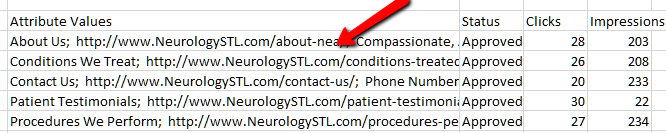
It looks like this.
Unfortunately, the report clumps all the attribute value (sitelink, URL, and enhanced text) in one cell. Before you give up too quickly, there is a very fast way around this.
2) Format Raw Data
GET READY FOR MAGIC! We are going to break all this jumble apart so you can pivot it.
- Insert 5 rows after the attribute value column.
- Highlight column A
-
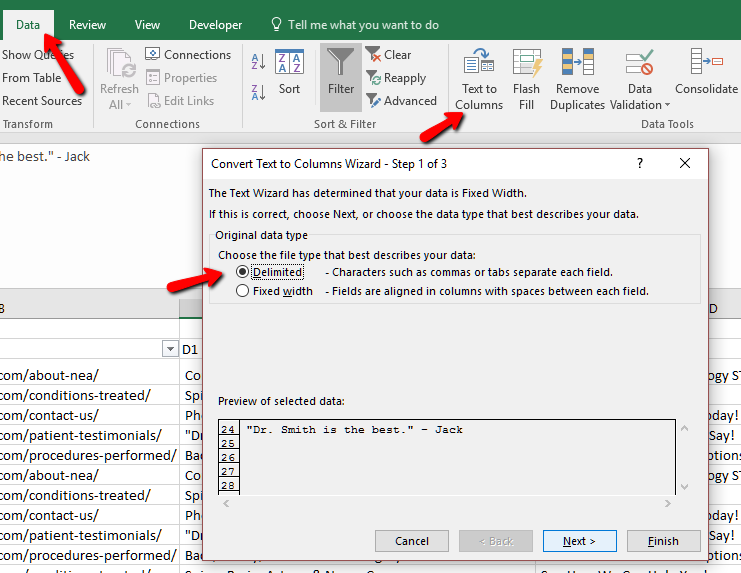
- Data Tab > “Text to Column”
- “Delimited” > Next
- Check : Semicolon > Next > Finish
- Data Tab > “Text to Column”
-
Voila! If it ran over any of your data – START OVER. Check that you have all the original columns. I told you to do 5 columns, and you should have only needed 3 more.
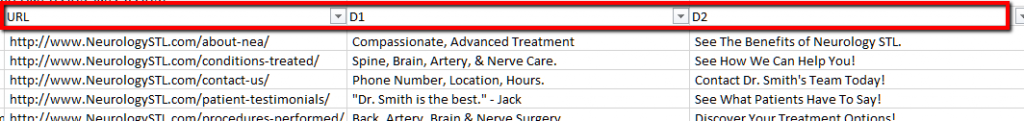
3) Name Your Columns: URL, D1, D2.Sample Sitelink Pivot Analysis For Blog Post
For analysis purposes, we want to put D1 & D2 together. So in Column E (or the next open column) header it “D1+D2” and insert the formula in the image below to marry these two together.

4) Clean up your book.
Pivot tables won’t work with blank columns. In my report, I had a blank column between my data. Remove.
5) Set up your Pivot Table.
Open New Sheet > Insert Tab > Pivot > Collect Your Data Range
-
-
-
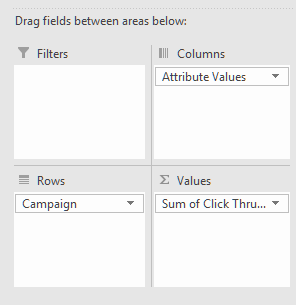
- Drag “Campaign” Into Rows Field
- Drag Attribute Values (or if you renamed it sitelink) into the Columns section
- Created a Calculated field for Click Thru Rate (Never, ever sum or average a CTR in a pivot table)
-
-
-
-
-
-
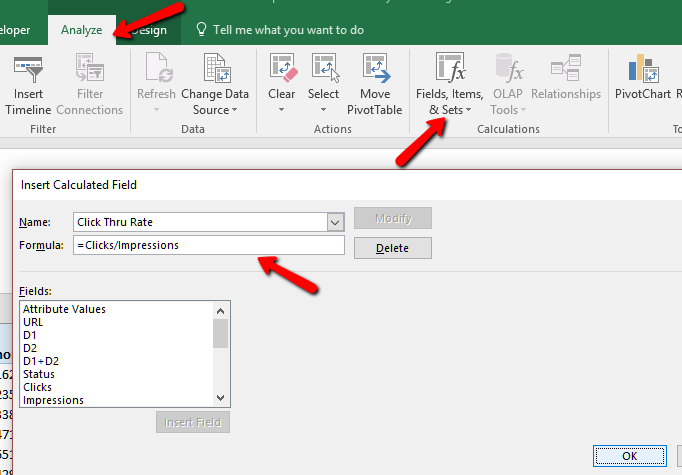
- In Analyze Tab > “Fields, Items, & Sets” > “Calcolated Field”
- Name it Click Thru Rate
- Insert fields “Clicks” “/” “Impressions” > OK
- NOW you can put the newly created “Click Thru Rate” in the Values Field in pivot Table. Below is how the fields should look.
-
-
-
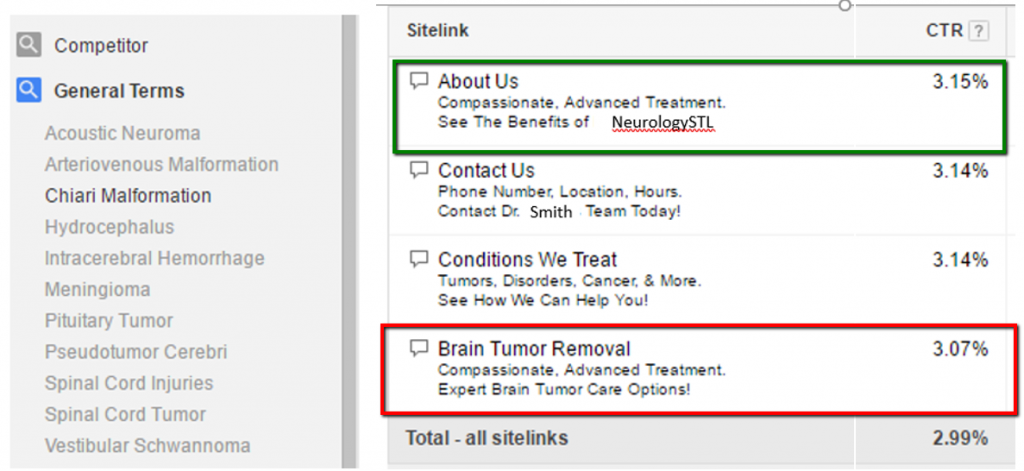
This is the output:
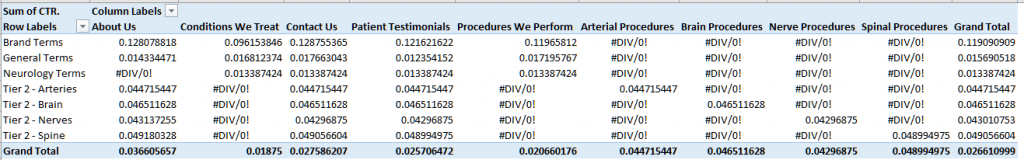
You’ll see alot of errors especially if you are not using sitelinks across all campaigns.
From here, I copy it into its own sheet so I can edit.
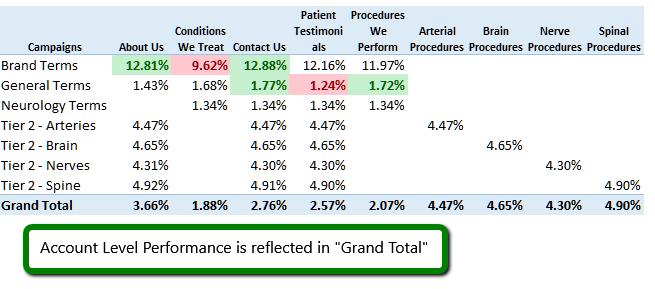
Once pasted in a new sheet, remove the errors, change to percentage and this is what you get: Good enough for most of the stuff you’ll do.
In the below screenshot you are able to see the impact of the sitelinks that we use across multiple campaigns, like “Contact Us.” We can also see how they compete within the same campaign.
BONUS: The final sheet titled “Fancy – Completed” pulls back in the Descriptions associated with the sitelink headline. That is a bit more complex and involves VLOOKUP. For the brave souls who want to continue, you can see the VLOOKUP formulas in the worksheet.
Improve Your Extensions Improve Your Quality
This approach can be used for all types of extensions like call outs, structured, snippets, etc.
Whether it’s manually going through campaigns or aggregating the data in meaningful ways using Excel and pivot tables, sitelinks are an important part of your PPC account. They are often overlooked and could be ways to significantly improve your AdWords quality score.