
Science is knowledge about or study of the natural world based on facts learned through experiments and observation. Marketing is the activity, set of institutions, and processes for creating, communicating, delivering, and exchanging offerings that have value.
Today we are going to discuss how we can use science to be better marketers by applying the scientific method to our digital marketing, ensuring an objective, standardized approach to our campaigns and minimizing the influence of our own biases.
We are in a digital world; data is everywhere but are we using this data properly?
Too often marketers – myself included – use data to prove an existing hypothesis. We have (or believe we have) the answers and are searching for the data to support our claims.
It’s too easy to have a theory and go out looking for data to prove the theory. Instead, we should use data to make observations and ask questions.
Then we can form a hypothesis, conduct an experiment to test this hypothesis, and use the experiment results to determine a conclusion.
Before we get started here are some key foundations of the scientific method:
- All hypothesis must be testable and falsifiable.
- Research should involve both deductive and inductive reasoning.
- An experiment must include a dependent and independent variable.
- An experiment must include an experimental group and a control group.
Below we will go through each step to the scientific method, how to apply this to your digital marketing, and the tools available to help you.
*Note: we will go through an example related to PPC advertising, but this approach can be applied to all areas of marketing and business.
![]()
Make Observations and Formulate a Question
This may be the most crucial step, but is also the step most often overlooked by marketers.
As marketers, we are always on top of the latest trends, keeping tabs on our KPIs, and constantly launching new campaigns or tweaking the ones already running. We have our hypothesis on why things are the way they are then go out looking for data to support our claim.
We need to make observations, ask questions, and really understand why things are happening before we form our hypothesis – or worse, jump to conclusions. This step allows us to make observations, identify a problem (or opportunity), and formulate relevant questions.
Example: We notice declining click and lead volume in one of our search campaigns. Further observations see our average position, click-through rate, and total impressions have significantly decreased, but our conversion rate and cost per click have only slightly dropped causing our cost per lead to increase. Initially we might see the increasing cost per lead and lower our bid, or exclude certain segments of our audience, but a closer look at the data helps us formulate the right questions. Instead of asking how we can lower our CPA we need to ask why do we have fewer impressions than we did before? How can we increase campaign delivery and click-through rate? Did anything change competitively or within AdWords?
Do Background Research and Gather Facts
Conducting background research and gathering facts can take many forms.
Start with your campaign and state your observations as facts – and dig deep. Look at industry research, changes to AdWords or other marketing products you’re using, evaluate the competitive landscape, identify new marketing products or features, and explore any other significant changes to other marketing activities (both digital and offline).
Example: Our average position has dropped, but our CPC has not followed suit the way it should. A deeper dive uncovers some new competition. We also see our quality score has dropped, but overall search volume for our keywords hasn’t changed much. We also see we are still rotating our ads evenly with A/B tests, instead of using the recommended optimized ad rotation. Further research on AdWords ad rotations reveals using an optimized ad rotation can look at signals specific to a query and send to auction our ad with the best quality score.
Form a Hypothesis
Now that you’ve made observations, identified a problem (or opportunity), formulated questions, and conducted research on your questions, it’s time to form your hypothesis.
A hypothesis is a proposed explanation for a phenomenon made based on limited evidence. This is your starting point for further investigation. When forming a hypothesis, it is important to keep in mind this proposition is made without any assumption of truth. Most importantly, for a hypothesis to be scientific, it must be testable.
Example: Based on our observations and research we came up with the following hypothesis: switching our search campaign to an optimized ad rotation setting will improve our quality score and ad rank, leading to increased delivery, lower costs per click, and more leads at an improved cost per lead.
Conduct an Experiment
You’ve made observations, conducted research, and formed a hypothesis; now it’s time to test.
A good test starts with setting up the experiment, being clear about what metrics you are measuring, identifying the variables you’re testing, and establishing your experimental control.
Setting up a proper experiment can be tough, especially in the fast-paced, results driven world of digital marketing. Unfortunately, an improper experiment can lead to false results, so document the process. If you cannot duplicate your experiment and results, it is not a reliable experiment.
There are a lot of variables out of your control in AdWords, so it’s also best to test campaign changes in real-time. The best way to do this is by using drafts and experiments built into AdWords.
Example: To test our hypothesis, we will create a campaign draft, duplicating our original campaign (the control), changing only the ad rotation setting to optimized rotation (independent variable), and monitoring our key metrics of impressions, click-through rate, cost per click, and total leads (dependent variables). Now that you’ve drafted your campaign, put the test live in real-time by turning the newly created draft into an experiment, splitting traffic between your control and the experiment.
Analyze Results and Interpret the Data
The experiment has run and you have collected data; now it’s time to determine if the data supports or rejects your hypothesis.
A few things to keep in mind here are sample size and statistical significance (is the data conclusive or do we need to gather more data). You should set these parameters before you get the data. Do we need 95% confidence in our experiment, or do budget and time constraints mean we must decide with less data lowering our confidence interval?
Example: We ran an ad rotation experiment on one of our search campaigns using AdWords drafts and experiments, below are the results.
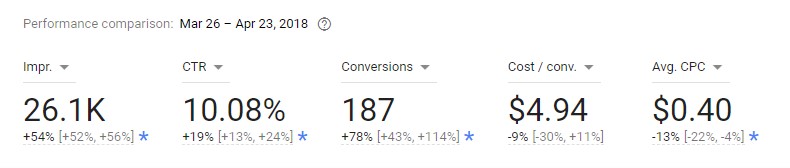
The results of our initial experiment supported our hypothesis and with 95% confidence we could show that an optimized ad rotation did indeed increase delivery (impressions +54%), lower cost per click (-13%), and increase conversions (+78%).
Refine, Alter, Expand, or Reject Hypothesis and Retest
After the initial experiment is done and you’ve analyzed the results, you have either supported or rejected your hypothesis.
The next step is to rewrite your hypothesis as a statement of truth and retest. You now have supporting evidence and your hypothesis is no longer a proposed explanation.
Rewrite your hypothesis, refining any parts not completely supported by your initial test and retest. You can retest the experiment either on the same campaign or a similar one, ensuring you are keeping a control and testing the same independent variable. Note: this step can and may need to be repeated several times, especially if you are seeing varying results.
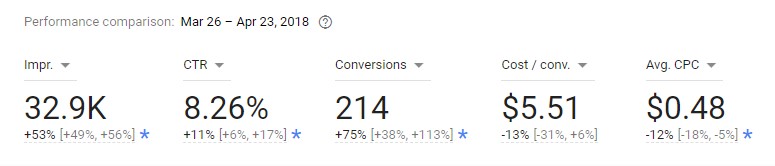
Example: Using the results of the original experiment, we rewrote our hypothesis and refined a few parts: switching our search campaign to an optimized ad rotation setting will increase our impressions, lower our cost per click, and generate more leads at a similar or improved cost per lead. We then expanded the experiment to another search campaign to validate the initial experiment by replicating the results.
Draw a Conclusion, Report Your Results, and Scale
If the experiment results completely support your hypothesis, report your results to the key stakeholders. Once you’ve reported your results, look for all the ways to apply your learnings and look for opportunities to scale.
If your results align only partially or not at all with your hypothesis, your experimental data then becomes background research for new/future projects. Form a new hypothesis and experiment again.
Example: In our example of using an optimized ad rotation, instead of rotating ads indefinitely while A/B testing, we found our data supported our hypothesis. We concluded with 95% confidence that an optimized ad rotation setting will increase impressions, lower cost per click, and generate more leads at a lower or similar CPA for search campaigns. We then took these learnings and applied optimized ad rotation settings to all search campaigns in the account. We could have continued retesting to support the hypothesis and increase our confidence level, but budget and time constraints led us to say 95% confidence was enough to draw a conclusion and scale the results.
Now it is time to use the scientific method to eliminate biases and be better marketers. How are you using science to be a better marketer? Leave your answers in the comments below or join the conversation on Twitter @toeknee_c or @RocketClicks.
Not sure how to apply the scientific method to your own digital marketing? Rocket Clicks can help! Contact us today for a free digital marketing consultation.