

Ninja Cat is an all-in-one reporting, monitoring, call tracking and data pipeline solution for leading digital marketing agencies and marketing companies.
This beginners guide will take you through the basics of the reporting template, and it will show you how to update scorecard widgets, graphs and charts. These tips are meant to create ease when updating Ninja Cat reporting.
NinjaCat Reporting Basics
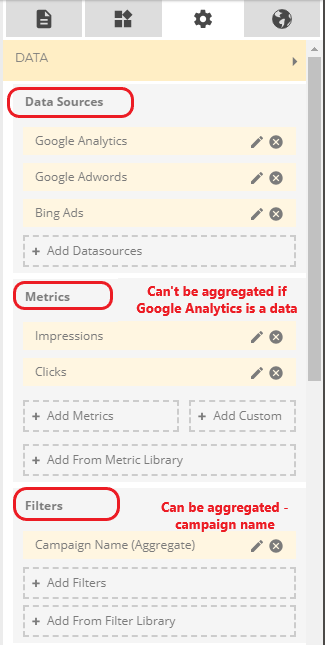
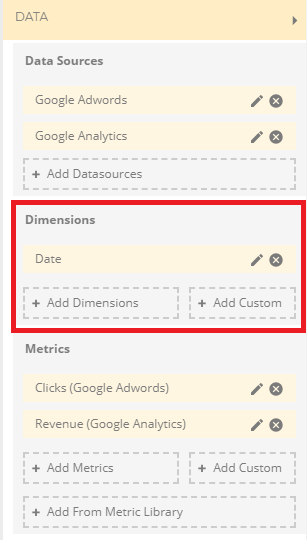
- NinjaCat Data Sources – this is where you choose what data you’d like to pull for your report. This includes Google Analytics, Google Ads, Bing Ads, etc.
- NinjaCat Metrics – here is where you can leverage your data (impressions, clicks, conversions etc.)
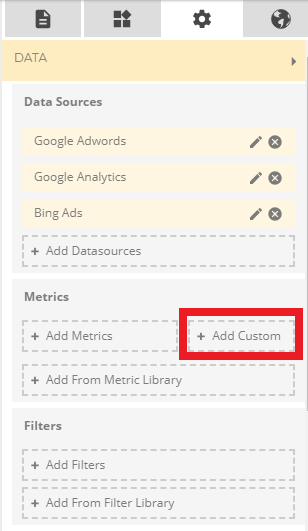
- It gives the ability to create custom metrics if you need to pull cost from Google Ads and revenue from Google Analytics, among other networks
- Note: If you are using Google Analytics and Google Ads/Bing Ads, you should not use the aggregated metrics. Rather, you will have to create custom metrics to pull all of your data in
- NinjaCat Filters – these allow you to filter the data that you need
- eg: If you have two accounts within one Google Ads data source, using filters will help you separate data
- Aggregation can be used if you’re using the same campaign names across different data sources
Creating Premade and Custom Metrics in a NinjaCat Report:
- Creating a Metric
- Use the “+Add Metrics” to add what you need
- Once you’re in the metrics section there is a search bar for ease
- Updating Premade Metrics
- To update or edit, use the pencil icon
- If it’s a premade metric, you can still rename it using Custom Display name. This is useful since most metrics will include the data source
- It is also recommended to change the Integer Format at this level
- To update or edit, use the pencil icon
- Creating Custom Metrics
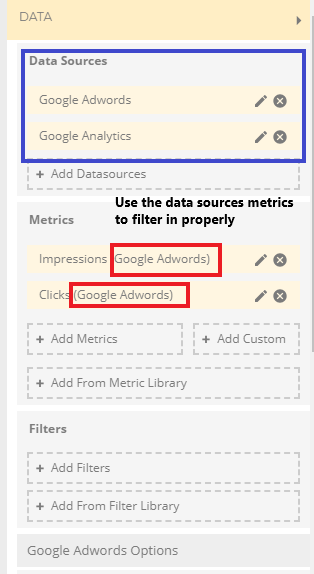
- Since custom metrics are formula-based, you need to use Google Analytics as a data source PLUS any other network(s) you will either have to use that data source metric or combine with custom metrics to get the correct information
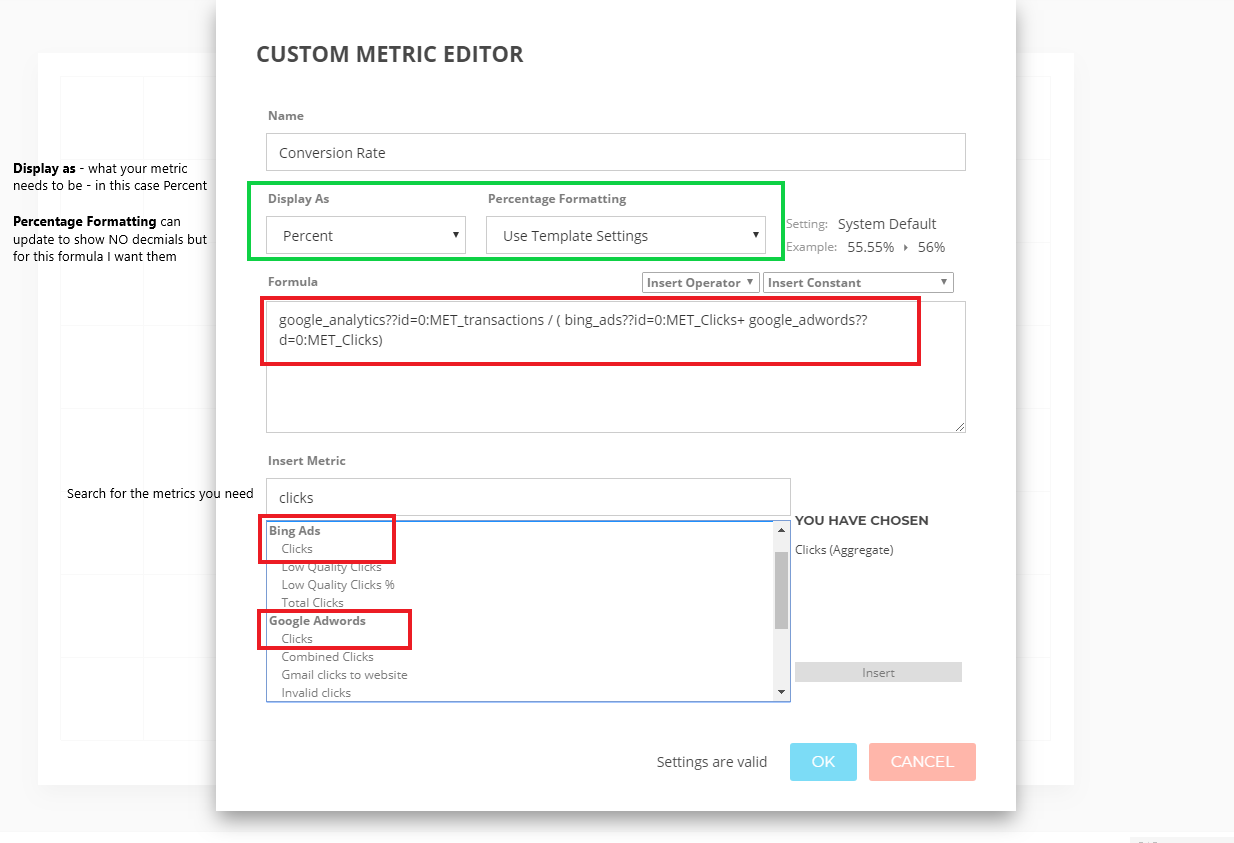
- If you have a custom metric like conversion rate and you have to use Google Analytics transactions metric. You’ll need to divide by all the data sources clicks
Creating Filters in NinjaCat
- Filters are meant to help remove or filter out specific data, whether that be campaigns, keywords, ads etc.
- eg: an account on Google Ads has two businesses within one account.
- You will use campaign name ot filter out which one you want to report on
Creating Bar or Line Graphs in NinjaCat
- The biggest difference here is that you need to include a dimension. This could be things like campaign name, region, months etc
- Bar and line graphs are useful to show trends
Other NinjaCat tips and tricks
- To get your metrics to appear on the same line, scroll down to Properties > find the section that says “Numbers of Metrics Per Row.” This allows you to put as many or as few metrics on one row as you’d like
- If you want to see Comparison Values, scroll down to Properties and find the slider that says “Show Comparison Value”
- You can change the comparison time frame by going to the section under Filters that says Comparison
- Options are previous month, year, period, no comparison and custom
While these are the basics for updating a NinjaCat Report, knowing how you can use them for creating meaningful reports with client-specific KPIs will give you a base for further exploration. This reporting platform allows you to pull from a bevy of data sources and compile the data into easy-to-digest data scorecards and charts, and for that reason alone it’s worth diving into.