We do plenty of reporting here at Rocket Clicks, but almost everything we generate is client-facing – technical audits, competitive research, keyword performance and the like. What I didn’t have – as the department head – was an internal document where I could quickly review performance across our client book.
Monthly performance reviews and deep dive analysis wasn’t what I needed – what I needed was a weekly client update with desert island metrics – an internal C-Suite dashboard that at-a-glance tells me how we’re trending while at the same time helping to get out in front of potential issues. Ultimately, a quick look at high-level numbers that, if I were stranded on a desert island, would be enough to keep me in the loop for the clients we work with.
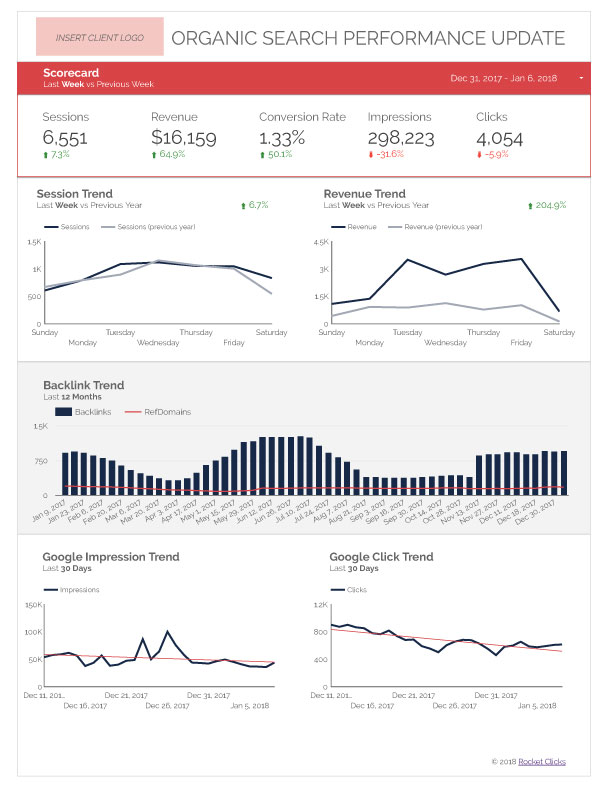
Here’s what we came up with:
To be clear, this report is not intended to replace detailed analysis. In fact, it’s not meant to be client facing at all.
Rather, this is a practical SEO dashboard where managers and directors can quickly review client performance, sniff out issues and gauge the effectiveness of ongoing optimization efforts.
The Report in Detail
The Scorecard row near the top shows fundamental week-over-week stats and is controlled by the date selector in the upper-right corner. This is particularly useful if you like to frequently share quick wins with your clients (“Hi Bob, I just noticed that organic traffic witnessed a 20% increase in revenue last week! We can discuss this more on our monthly call, but we’re excited to see this level of growth!”).
Below the Scorecard we have year-over-year trends for traffic and conversions over the last week.
I’d really prefer to stretch this out to the last 30 days, but it’s not an option for Data Studio at the moment, and manually adjusting dates would take away the automation factor. Still, the advantage here is that you’re minimizing seasonality to get a better grasp of site health.
Next are backlink and referring domain trends – for obvious reasons.
We currently pull this data from a Google Sheet via the Majestic API – I wrote a whole post on this process here.
You’re welcome to plug-in your own backlink tracking solution here, but I highly recommend making it a weekly touch point. A backlink profile can go sideways pretty quickly, and in my opinion, waiting a full month to review is too long.
Finally, I pull 30 days of impression and click data from Search Console.
This might seem too high level at first, but the main takeaway here is the trendline – if you’re in the midst of a content push or other site publishing activity, you can quickly determine whether it’s having the desired effect.
So there you have it – an always-up-to-date, high-level look at client performance for any and all clients in your book. I hope you find it useful.
Download the Report
You can give the Desert Island SEO Dashboard a spin by making a copy of it here. The report uses sample Analytics and Search Console data, but the backlink section will be blank, since the report is set to pull these from a private spreadsheet. Feel free copy and play with the design to suit your own needs, and check out my post on automating backlink metrics from the Majestic API to get the backlink section working properly.